Three outliers, one root cause: fixing PSO, FPA and GSA
November 22, 2026
Teeline benchmarks every solver on 12 standard TSP maps and reports its gap: how much longer its tour is than the best known one, as a percentage. Most solvers land in the single digits or low twenties. Three did not: PSO at 150.35%, FPA at 253.94%, GSA at 190.52%. On the largest map, dsj1000 with 1,000 cities, the gaps ran to 2,340%, 2,655% and 2,504%.
They were not slow: all three finish in a second or two on average, and the fixes only added a 2-opt polish. Against a 300-second budget, they were fast and bad.
PSO (Particle Swarm Optimization) is modelled on a flock of birds, FPA (Flower Pollination Algorithm) on pollinating flowers, GSA (Gravitational Search Algorithm) on Newton’s gravity. Different metaphors, same failure — and, it turned out, the same fix.
Where the translation went wrong
Each paper defines its update in continuous space: a particle moves by a velocity, a flower takes a Lévy-scaled step toward the best, an agent is pulled by a gravitational force. On a map, a solution is a permutation of cities. I translated “move toward the best” into “swap two city positions” — the obvious textbook move, and the wrong one.
On a list of cities, a “small” change can wreck the tour. A tour is a cycle of edges, and one swap can break four of them at once:
tour:      A B C D E F
swap B, E: A E C D B F
The edges A–B, B–C, D–E and E–F are gone. Four edges replaced for one “small” move. 2-opt, which appears below, replaces only two — and picks them on purpose.
There is a second problem. The same loop can be written many ways — A B C D E F, B C D E F A, and so on. Compare the first two slot by slot and every single position differs, yet they are the same loop with the same length. A swarm told to “match the best tour position by position” burns its moves rotating the list into line, which shortens nothing. The trio also started from random permutations and had no local search to recover.
The fix, in one sentence
A tour is made of edges, so change edges, not list positions.
The shared playbook was:
- Order crossover. Copy a contiguous segment of a good tour, then fill the remaining cities in the current tour’s order. The child inherits the target’s internal edges, breaks only the two seams, and — because it copies a stretch of the loop — doesn’t care where the list happens to start.
- A nearest-neighbour start. Half the population begins from a greedy “always visit the closest unvisited city” tour; the other half stays random for diversity.
- A final 2-opt polish. Uncross edges until no simple swap shortens the loop.
Each solver kept its own character — PSO still follows personal and global bests, FPA still mixes long and short jumps, GSA still lets heavier (better) tours pull harder. What changed is the move underneath: an order crossover instead of a position swap.
This is a memetic adaptation, not a new published algorithm: a population method for exploration, a local search for exploitation.
The numbers
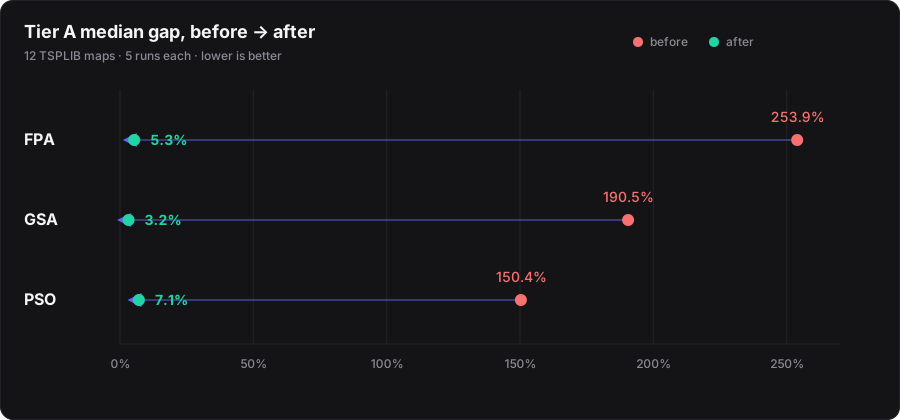
| Solver | Median gap before | After | dsj1000 before → after (5 runs) |
|---|---|---|---|
| PSO | 150.35% | 7.08% | 2,340.27% → 10.35% |
| FPA | 253.94% | 5.31% | 2,654.97% → 9.25% |
| GSA | 190.52% | 3.24% | 2,503.87% → 11.98% |
Median of the 12 per-instance medians, each over five runs. The landing chart plots berlin52 alone, one of the smaller maps; across all 12 the before gaps were worse. The headline median is helped by the small maps, where all three reach or nearly reach the optimum; on the larger maps they land at roughly 6–12%, in the same range as SA, GA and ACO.
Who does the work on big maps
On 52–100 cities, the swarm does real work: the population starts around 25–55% and the loop pulls it down to single digits. By 280–1,000 cities, the same loop stalls near its nearest-neighbour seed, and the final 2-opt polish supplies most of the gain.
That is the normal shape of a memetic algorithm — a population search plus a local polish. It is the same reason Memetic EAX polishes every child with 2-opt.
And 2-opt is an edge move too — so on big maps the “change edges” lesson is doing the work, just through the polish instead of the crossover.
What this taught us
The move matters more than the metaphor. The population dynamics in all three papers were not the problem — the swarm, the pollination, the gravity. The move was what made them look broken. Any metaphor collapses if its move destroys the thing it is supposed to optimize.
The benchmark chart was more useful as a diagnostic than a scoreboard. Three dots stranded far from the pack didn’t just say “these lose” — they asked why, and the answer was the same for all three. Producing a valid tour isn’t the same as producing a good one; only measuring showed the difference.
Go deeper
- PSO, FPA and GSA — each with a
2.0.0changelog and its benchmark table. - The EAX post makes the same “edges, not order” argument from the other direction.
- Run any of them on the solver.
The next time a chart looks wrong, the algorithm may be fine. Check the move.